Overview
Teaching: 5 min
Exercises: 15 minQuestionsObjectives
- How do you trace what is happening in a microservice using centralised logging system
- Trace Event on Microservice chain via logs
- Perform log aggregation for better log analysis
Task 1 – Microservice Log Aggregation
From Session 2, we covered the deployment of Microservice components (Cashier,Waiter and Coffee-machines) unto Kubernetes cluster on GCP platform with Jenkins CI server
This session we will look at how these interactiuon and behavior of these componets via log aggregtion shipped into a centralised system.
By the end of this section you should be able to:
- Trace Event chains from one Microservice component to another using customised generated Correlation ID (X-Request-ID header)
- Perform log aggrgation by creating searches, views and Dashboards in Graylog Server.
Reminder !!!:
You must have jq and curl programs installed in your computers before you begin this lesson.
Tracing Events with Correlation ID (X-Request-ID Search)
- Clone cessda.cafe and change directory to
cessda.cafedirectory. - Run the Customer Script
In the cessda.cafe (Assumed it is cloned on to your computers)- Execute the command below in a shell
bash customer.sh -
Save your correlation ID (X-Request-ID)
Notice the customised X-Request-IDs from the output highlighted in the image below; they are in a form:
" customer-$USER-$HOSTNAME-$INSTANCE-timestamped"where $INSTANCE is random translated 6 characters.
Save those !!!
Example is:
customer-joshocan-LAPTOP-JBQU980N-FWXKCT-15754779342 -
Login to Greylog UI and enter the following
username : (To be provided)
Password : (To be provided) -
After login to the Greylog Server, Go to Streams menu and navigate to CESSDA-Café log stream
-
Search with X-Request-Id above and paste in the search as shown below:
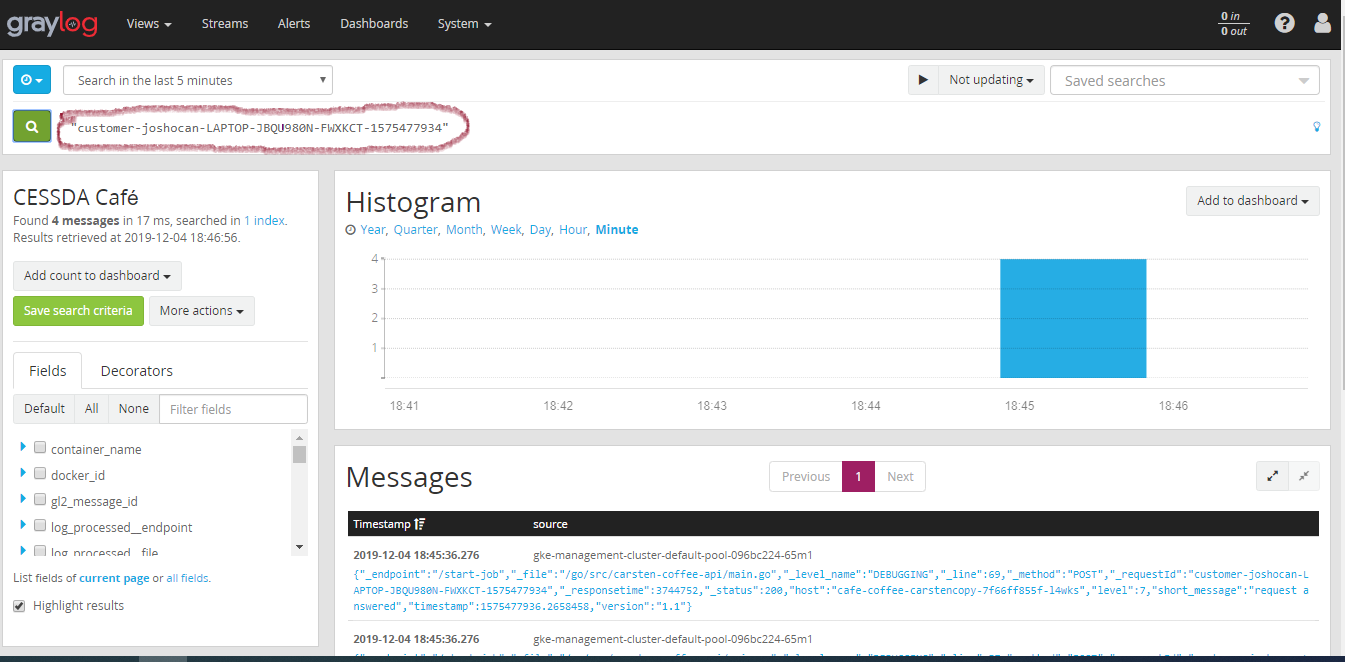
- Now, Let trace logs events for the X-Request-ID
Creating Log Views
Whether you’re trying to track down a particular order session or we want to know how coffee jobs are changing in realtime then you need to create a view visualisation.
Views are based on variable inputs so they easily adapt and change to each situation. Best of all, they can be easily saved and shared to create consistency and save time to analyze your microservices. You can put all your regular searches and visualizations for a particular type of analysis all on one page, initiated by input variables of your choice.
-
Go to Views menu and select “create new”
-
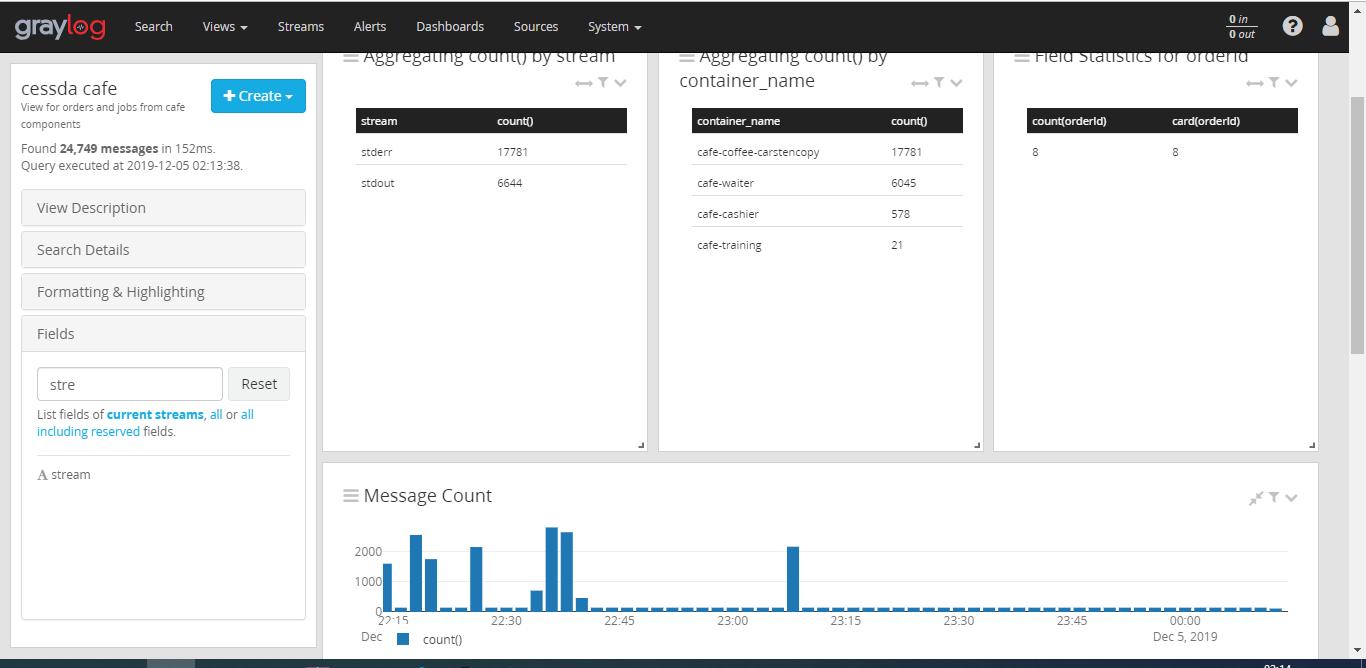
Select the steam to include in the view search; from the dropbox select “CESSDA Café” as your source stream
-
At the Filter Field panel, add the fields you want to show or display in the view. For our example, you can select “Aggregate” in each of the followwing fields : orderId, stream and container_name
-
You can live update your view by selecting update time for example 1 minute “Not Update” dropbox
-
Click on View Actions button to select “save as” to save the view
-
To see you created view, Click on views menu and then select your named views
Creating Graylog Dashboard
Dashboards allow you to build pre-defined views on your log dataset. However, you should be able to figure out the search queries to get the correct results for your specific applications.
-
Navigate page to Dashboard by clicking on Dashboards menu of the page.
-
Click on create dashboard button to create a dashboard. type “title” and Description of the new dashboard to finish the creation.
-
Creating and adding Widget to the Dashboard.
Widget are visualised logs in terms of graphs and charts.
-
Go to Streams menu and navigate to CESSDA-Café log stream
-
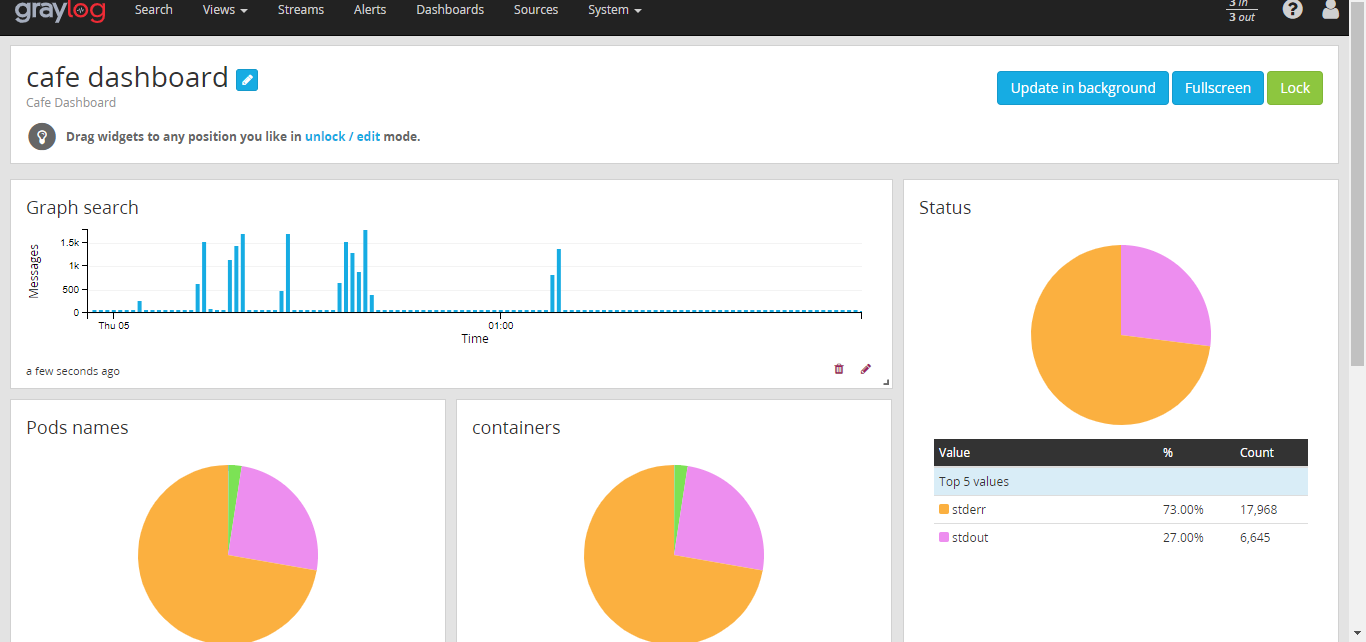
At the Filter Field panel, add the fields you want to show or display in the search. For our example, click on the arrow beside a field and then you either select “Generate chart”, Quick values or Statistics to generate Pie-chart, Bar graph or table in each of the followwing: stream, pod_name and container_name
-
On top of each of the chart or graph click on Add to dashboard button to add widget to the dashboard created earlier.
-
To see you created dashboard, Click on Dashboards menu and then select your named dashboard
Reference Links
- https://www.graylog.org/features/views
- https://docs.graylog.org/en/3.1/pages/dashboards.html
- https://www.graylog.org/post/importance-of-event-correlation-techniques-in-siem
- https://devops.com/log-monitoring-and-analysis-comparing-elk-splunk-and-graylog/
- https://www.graylog.org/products/open-source-vs-enterprise