Microservices Interaction: Task 2 – Performance Monitoring and Analysis
Overview
Teaching: 5 min
Exercises: 5 minQuestionsObjectives
- How are Cafe Microservice components Performing on a Cluster
- Conduct performance analysis on Microservice with Grafana Dashboard
Task 2 – Performance Monitoring and Analysis
In this exercise, we analyse performance trends of of Microservice components deployed in Session 2 and any other application that is of interest.
-
Login to Grafana Monitor with your bitbucket credential
-
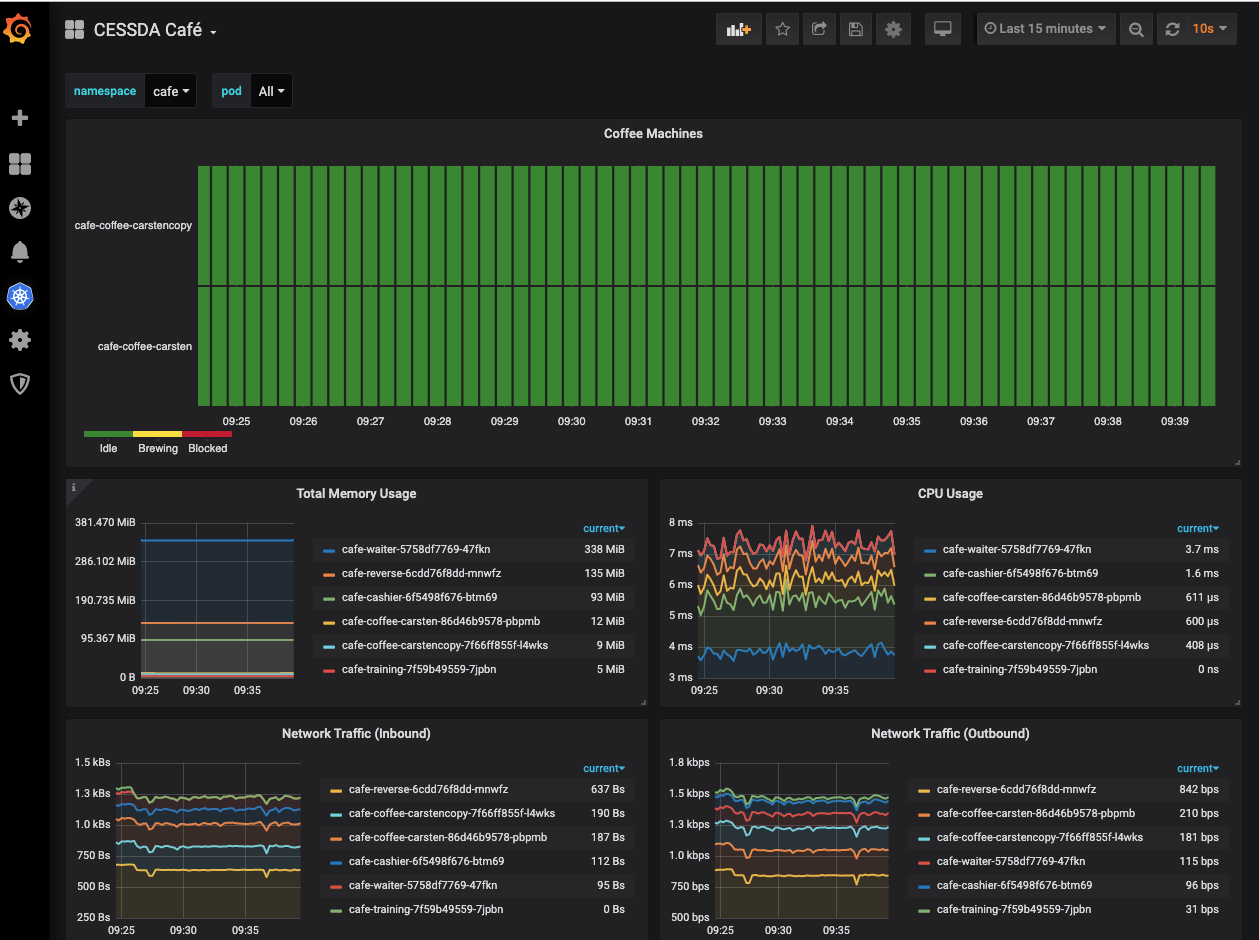
At the home page of the portal, Hit Home Dashboard and select CESSDA Café dashboard
-
Now Let Analyse and Discuss
-
Execute the command below in a shell again and observe the behaviour of the components
bash customer.sh
Performance Analysis
- What is state of each of coffee machines (Idle, Brewing or Blocked ) within a period and why
- How much resoruce (memory or cpu) does each of the components consumed
-
Do we notice a spike on graph and what might be the cause of it
Reference Links
- Deploy Prometheus Grafana stack in Kubenetes
- https://devopscube.com/setup-prometheus-monitoring-on-kubernetes/
- https://grafana.com/grafana/dashboards
- https://logz.io/blog/grafana-vs-kibana/